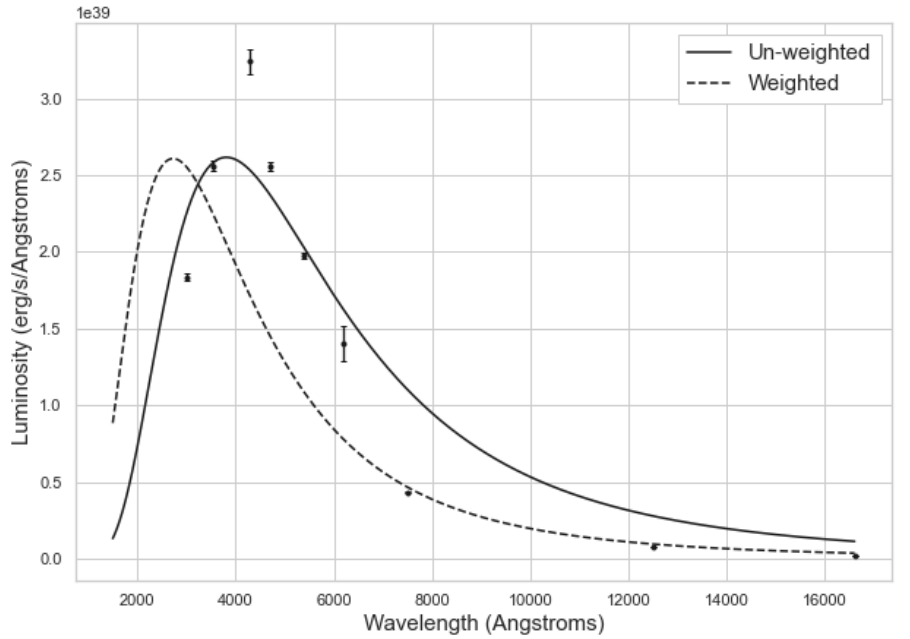
Figure 2: Spectral energy distribution presenting luminosity data with error bars of 1𝜎-uncertainty (circular points) against wavelength in Angstroms of SN2012fr at the epoch 1.55 days after maximum B-filter brightness. Planck’s blackbody function is fitted to these data points (black solid line) with the consideration of statistical weight. Some error bars may be too small to be seen
In this project data from a Type Ia supernovae SN 2012fr was analysed from 12 days before maximum brightness to 170 days after in the effort to determine if the light from the event could be approximated to emit as a black-body. First, what is a black-body? A black-body is matter in thermodynamic equilibrium which emits the same amount of energy as it absorbs. This emission has different intensities across the electromagnetic spectrum. If you plot the intensity versus the wavelength of this light it produces a distribution which is described by Max Planck’s black-body distribution. The distributions shape only depends on the temperature of the black-body and it is this behaviour which makes Planck’s distribution so powerful. If one can fit this defined distribution to a set of intensity measurements one can determine the temperature and therefore the energy of the black-body, in this case a supernova.
The focus of my study was SN 2012fr a generic Type Ia supernova found in its host galaxy, NGC 1365 (see figure 1). The observations of this supernova were shared across a number of telescopes in order to see this event in different wavelengths of light, ultraviolet (UV), optical, and near-infrared (NIR). With this data, a spectral energy diagram was plotted (intensity of light versus wavelength) and a Python algorithm was implemented to create a ‘best-fit’ black-body distribution to the data. This was done both with and without taking into the account the uncertainties in the measurements (statistical weight). Finally, analysis with the chi-square ‘goodness of fit’ statistic was employed to quantify how well the model fitted to the data. See the plot below to see the Planck function modelled to the observational data points (figure 2).
From statistical analysis it was determined that SN 2012fr’s spectral energy diagrams could be approximated by Planck’s black-body distribution. However, there were indications from the chi-square statistic that around +40 days after maximum brightness the Planck function became a less viable approximation. Observational reports suggested that the decrease in quality of the model could be explained by a change in the contribution of the UV and NIR leading to an over estimation for the temperature and therefore energy. Though, due to a sound approximation of the model in earlier epochs it was determined that the total energy emission of SN 2012fr was of the order 10^42 [ergs^-1], matching estimations from other/previous studies.
To see a full report on this project see the GitHub link at the top of the page.